This article was automatically translated from the original Turkish version.
The Ansoff Matrix is a strategic growth analysis tool developed by Igor Ansoff in 1957 within the literature of strategic management. It enables organizations to systematically evaluate their current and potential growth paths. The matrix defines four fundamental strategies through classification along product and market dimensions.
The Ansoff Matrix is structured around two main axes:
The intersection of these axes generates four growth strategies:
The risk levels, visually emphasized by colors in the diagram, increase toward the upper right corner of the matrix. Market penetration carries the lowest risk, while diversification carries the highest. In this way, the Ansoff Matrix helps organizations understand the risk-return balance when making growth decisions.
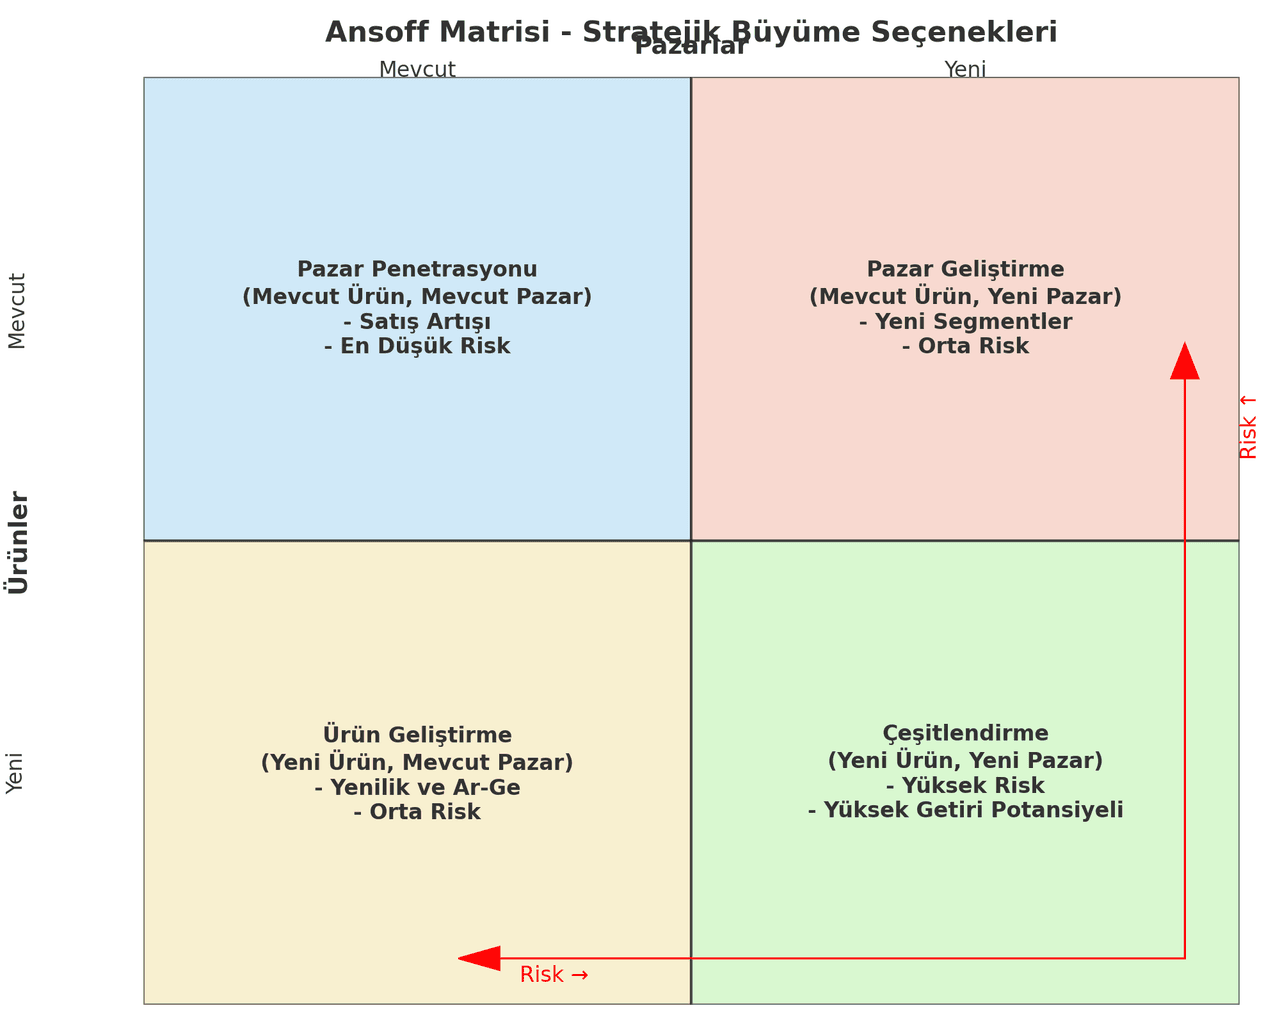
Ansoff Matrix (Image generated by Artificial Intelligence)
The above image illustrates the four strategic growth options of the Ansoff Matrix in a two-dimensional 2x2 grid format. The horizontal axis represents markets (existing and new), while the vertical axis represents products (existing and new). Each strategy cell includes brief definitions and information on risk levels. Red arrows extending from the upper right toward the lower left symbolize the increasing risk within the matrix. Colors are used to highlight the risk levels of the strategies.
Structure and Strategies of the Matrix
Risk Level and Strategic Significance