

This article was automatically translated from the original Turkish version.
International English Name | Hyperspectral Imaging (HSI) | ||||||||
|---|---|---|---|---|---|---|---|---|---|
Other Name | Imaging Spectroscopy | ||||||||
Relation to National Technology Initiative | Hyperspectral imaging, which requires the development of local sensors, optical systems, satellite and UAV platforms, as well as data processing software, contributes to reducing external dependency in defense, precision agriculture, environmental monitoring, and industrial quality control. In this regard, the technology is directly related to the National Technology Initiative goals of high-value domestic production and technological independence. | ||||||||
Technology Type | Optical imaging and remote sensing technology | ||||||||
Data Structure | Hyperspectral data cube (x, y, λ) | ||||||||
Fundamental Principle | Recording data in numerous adjacent and narrow spectral bands for each pixel | ||||||||
Application Areas | Precision agriculture, environmental monitoring, mining, defense, healthcare, food, and industrial quality control | ||||||||
Main Platforms | Satellite, aircraft, UAV, laboratory, and industrial imaging systems | ||||||||
Related Concepts | Spectral signature, electromagnetic spectrum, remote sensing, image processing | ||||||||
Hyperspectral imaging is an imaging technology that records electromagnetic radiation reflected or emitted from a scene in a large number of narrow and contiguous wavelength bands. While traditional color cameras construct an image using three broad bands—red, green and blue—hyperspectral systems generate a detailed spectrum for each pixel in the image. This enables objects to be distinguished not only by their shape and color but also by their chemical composition, physical state and interaction with light. The design, calibration and data processing of hyperspectral systems involve optical, electronic, materials science, data processing and metrology methods.
Hyperspectral images are represented as a three-dimensional “data cube” composed of two spatial dimensions and one spectral dimension. The technology is used in fields such as remote sensing, precision agriculture, mining, environmental monitoring, defense, medicine, food safety and industrial quality control.
Materials absorb, reflect or emit specific portions of incident electromagnetic energy. The variation of these interactions with wavelength produces a characteristic pattern known as the material’s “spectral signature.” Pigments in plant leaves, minerals in soil, atmospheric gases, synthetic materials and biological tissues can exhibit distinct spectral behaviors. Hyperspectral imaging captures these differences along with spatial location information, enabling the identification of materials or the analysis of their conditions within the scene.【1】
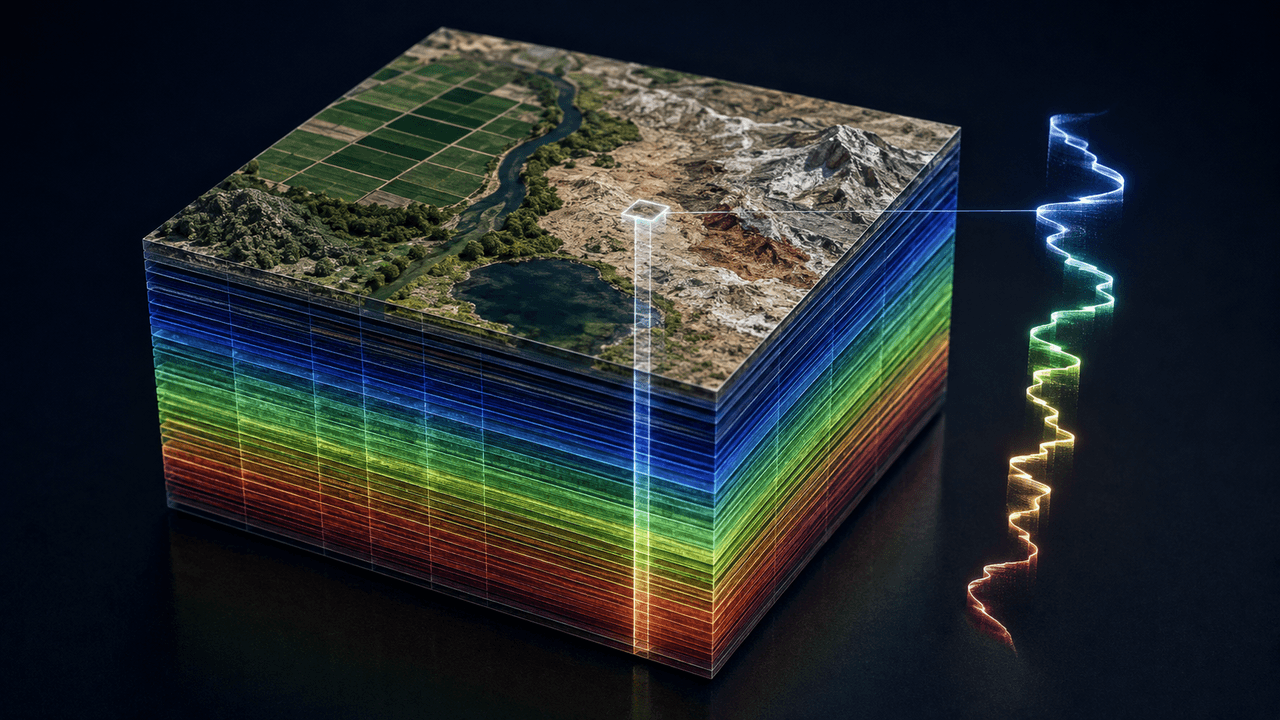
Hiperspektral veri küpünde iki uzamsal boyut ile çok sayıdaki spektral bandın birleşmesi ve seçilen bir piksele ait spektral imzanın temsili. (Yapay Zekâ ile Oluşturulmuştur)
A hyperspectral data cube can be mathematically expressed as I(x,y,λ), where x and y represent spatial coordinates in the image plane and λ denotes wavelength. A cross-section of the cube at a specific wavelength yields a two-dimensional image, while a cross-section along a single pixel provides the spectrum at that point.
The distinction between hyperspectral and multispectral imaging is not based solely on the number of bands. Multispectral systems measure in a limited number of selected, often discrete bands tailored for specific purposes, whereas hyperspectral systems sample a spectral range using many narrow and contiguous bands. The IEEE 4001 standard, adopted by IEEE in 2025, defines a hyperspectral system not by a fixed number of bands but by the continuous and sufficiently sampled measurement of a specified spectral range.【2】
The integration of spectroscopy with imaging began in the second half of the 20th century in remote sensing studies. The 1985 research by Alexander F. H. Goetz and colleagues addressed the theoretical and technical foundations of imaging spectroscopy for examining the Earth’s surface from aircraft and spacecraft.【3】
The Airborne Visible/Infrared Imaging Spectrometer (AVIRIS), developed by NASA’s Jet Propulsion Laboratory, measures the electromagnetic spectrum between 400 and 2,500 nanometers in 224 contiguous spectral channels to produce calibrated images.【4】 Data from this system have been used to map the spectral characteristics of minerals, plant species, fire-affected areas, coastal ecosystems and atmospheric components.
Hyperspectral systems are deployed on various platforms including satellites, aircraft, unmanned aerial vehicles, ground vehicles, laboratories and production lines. Portable and industrial systems may integrate compact sensors with embedded data processing units.
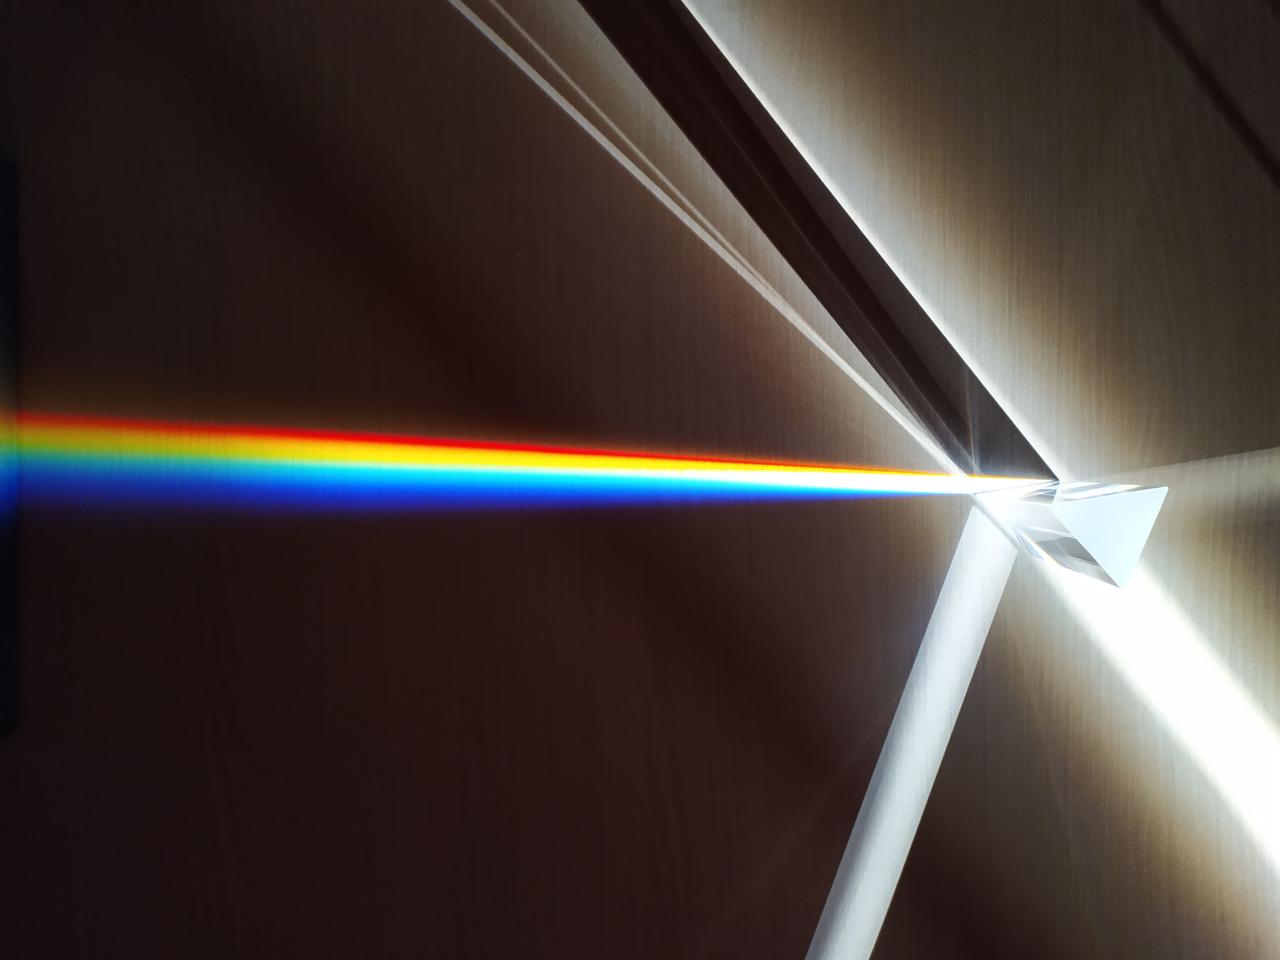
The hyperspectral imaging process begins with the interaction of energy from a natural or artificial light source with a target. The energy reflected or emitted from the target is collected by imaging optics and directed to a spectral dispersing component. Elements such as prisms, diffraction gratings or tunable optical filters separate the light by wavelength. The dispersed energy is then converted into an electrical signal by a detector array and recorded as digital data.
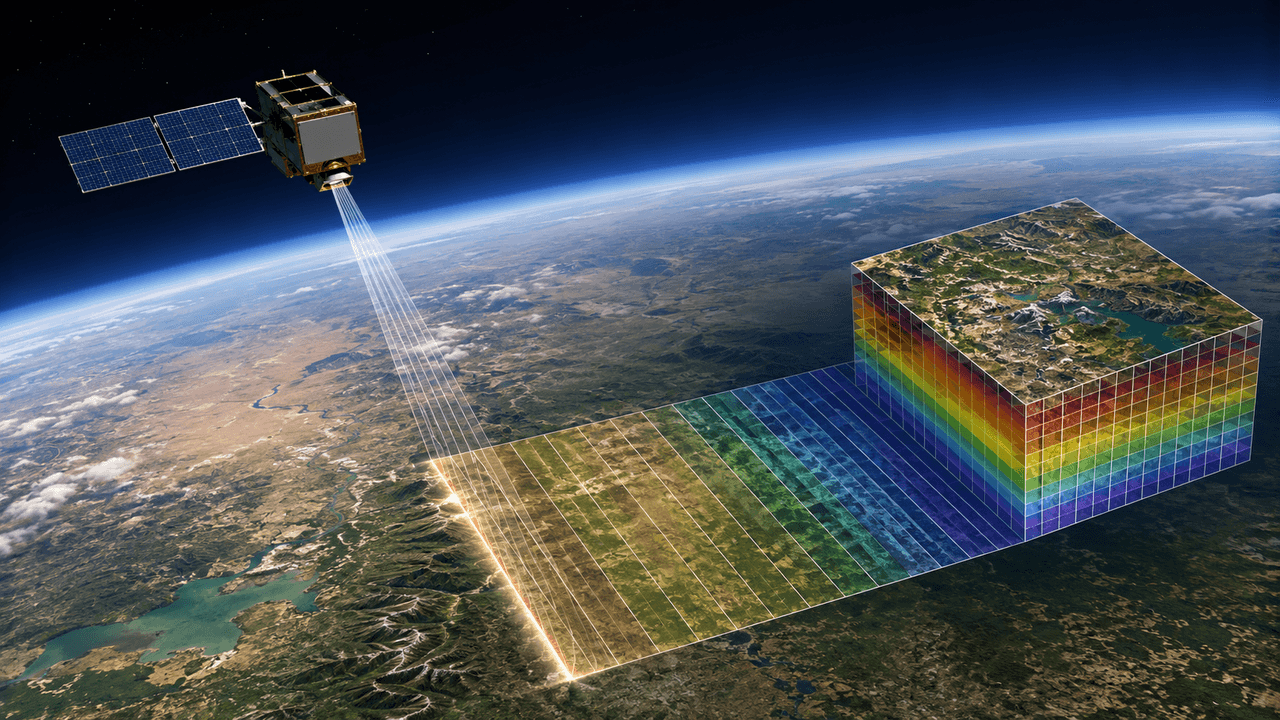
Çizgi tarama yönteminde dar bir yer şeridinden alınan ardışık ölçümlerin hiperspektral veri küpünü meydana getirmesi. (İrem Naz Acar)
The choice of detector material depends on the spectral region being measured. Silicon-based detectors are commonly used in the visible and near-infrared regions, while longer wavelengths may require indium gallium arsenide or cooled infrared detectors. The spectral resolution, spatial resolution, signal-to-noise ratio and radiometric accuracy of the sensor are interrelated. Narrower bands provide detailed spectral information but reduce the energy reaching each band, thereby increasing the impact of noise.
The main methods used to acquire hyperspectral data cubes are:
Raw hyperspectral data is not directly usable as a material map. Sensor noise, optical distortions, atmospheric effects, illumination conditions and platform motion can affect measurements. Therefore, preprocessing steps such as dark current correction, radiometric and wavelength calibration, atmospheric correction, geometric correction and removal of noisy bands are applied before analysis.
After corrections, data are typically converted to reflectance values and compared with spectral libraries containing reference spectra of known materials. The USGS High-Resolution Spectral Library contains reference spectra for minerals, rocks, soils, vegetation, microorganisms and man-made materials.【6】 However, the spectral signature of the same material can vary with moisture, surface roughness, age, temperature, illumination and observation angle. Classification studies often rely on field measurements and application-specific local spectral libraries.
Data consisting of hundreds of bands exhibit high dimensionality and strong inter-band correlation. Techniques such as principal component analysis, minimum noise fraction transformation and band selection can reduce data dimensionality. Support vector machines, random forests, artificial neural networks and deep learning models are used to classify materials or land cover.
When a single pixel contains signals from multiple materials, it creates a “mixed pixel” problem. Spectral unmixing aims to decompose the mixed spectrum into its pure constituent components and estimate their approximate proportions within the pixel. Linear models cannot always account for complex light scattering behavior, so unmixing results are validated against independent measurements.【7】
Hyperspectral remote sensing is used to map geological units and mineral-rich areas by exploiting the absorption characteristics of minerals. Soil mineral composition, salinity and organic matter content can also be analyzed using appropriate spectral and field data. The USGS evaluates imaging spectroscopy as one of the methods used for mineral mapping, soil property determination and natural hazard investigation.
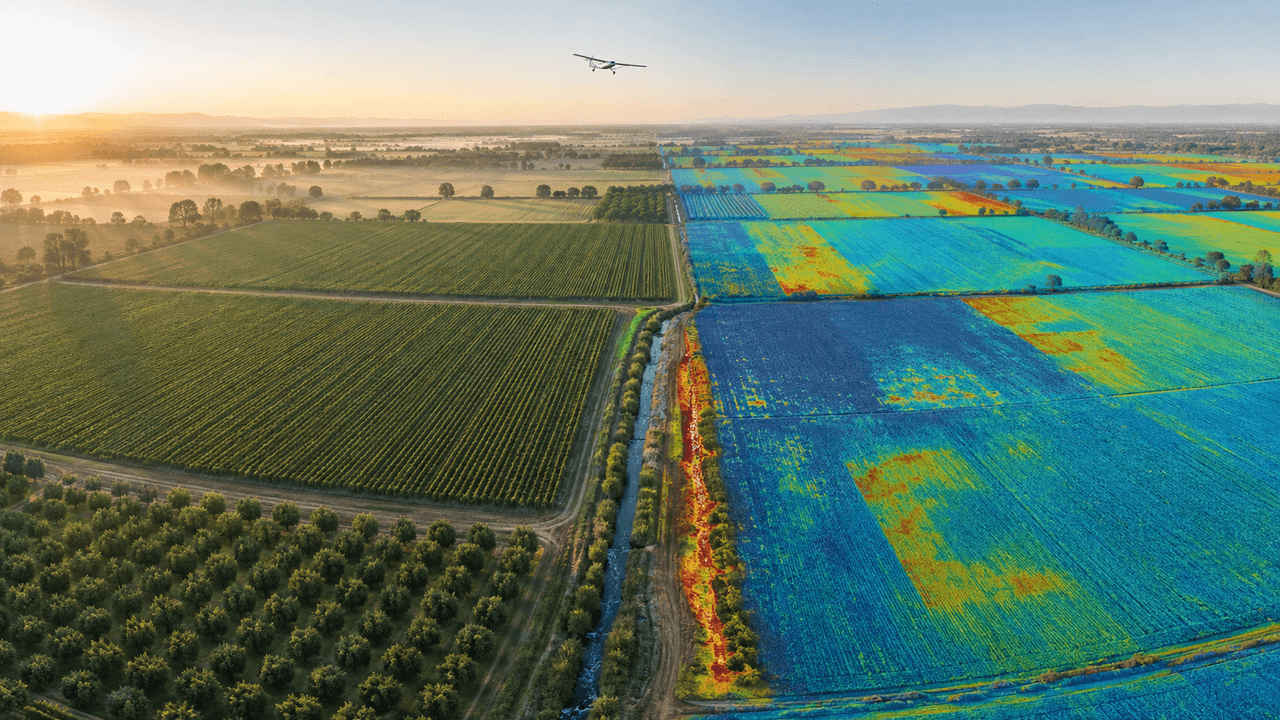
Tarım alanlarında çıplak gözle fark edilemeyen su stresi, hastalık riski ve toprak farklılıklarının hiperspektral görüntüleme yoluyla belirlenmesinin temsili. (İrem Naz Acar)
Plants exhibit different spectral responses in the visible and infrared regions due to variations in chlorophyll, water and nutrient status. Hyperspectral data are used to assess drought, disease, nutrient deficiency and pest damage. In precision agriculture, these data help determine spatial variability within fields to plan fertilizer and irrigation applications.
The technology is also applied in environmental monitoring tasks such as forest health assessment, post-fire damage analysis, wetland classification, water quality evaluation and pollutant detection. NASA’s EMIT imaging spectrometer has demonstrated the ability to identify not only surface minerals but also gases such as methane and carbon dioxide through their unique infrared absorption patterns.【8】
Hyperspectral imaging is used to analyze differences in spectral properties among paints, textiles, vegetation, soil and various synthetic materials. Applications in defense and security include detection of camouflaged targets, anomaly detection, surveillance of borders and critical facilities, and remote identification of chemical substances.
However, hyperspectral systems are not devices that can definitively identify all materials or see through obstacles. Atmospheric conditions, target distance, shadowing, sensor resolution and the quality of reference data directly affect detection performance. The reliability of defense applications depends on controlled tests and validation under real field conditions.【9】
Medical hyperspectral imaging is being researched to obtain non-contact information about tissue oxygenation and biochemical composition. Key research areas include detection of cancerous tissues, evaluation of surgical margins, monitoring of wound healing and examination of retinal diseases. A significant portion of medical applications remains in the research or clinical validation phase and has not yet been adopted as a general diagnostic method in clinical practice.【10】
In the food industry, hyperspectral imaging is used to non-destructively examine rot, foreign matter, moisture, fat and chemical composition differences in fruits and vegetables. Hyperspectral cameras mounted on production lines enable automatic product classification and separation of items that fail to meet specified criteria.【11】 In industrial applications, research focuses on homogeneity of pharmaceutical tablets, separation of plastic and textile types, detection of coating defects and classification of recyclable materials.
In hyperspectral imaging, spectral and spatial information are combined within a single data structure. This enables the simultaneous analysis of a material’s location and its spectral properties. The method is used for non-contact measurement, scanning large areas and detecting spectral differences that are indistinguishable in visible-band imagery.
The large number of bands generates substantial data volumes. Real-time transmission, storage and processing of this data may require high computational capacity. Trade-offs exist between spectral and spatial resolution, imaging speed and signal-to-noise ratio depending on the application. Sensor cost, calibration requirements, atmospheric effects, variable illumination, mixed pixels and the scope of training data are factors affecting system performance.
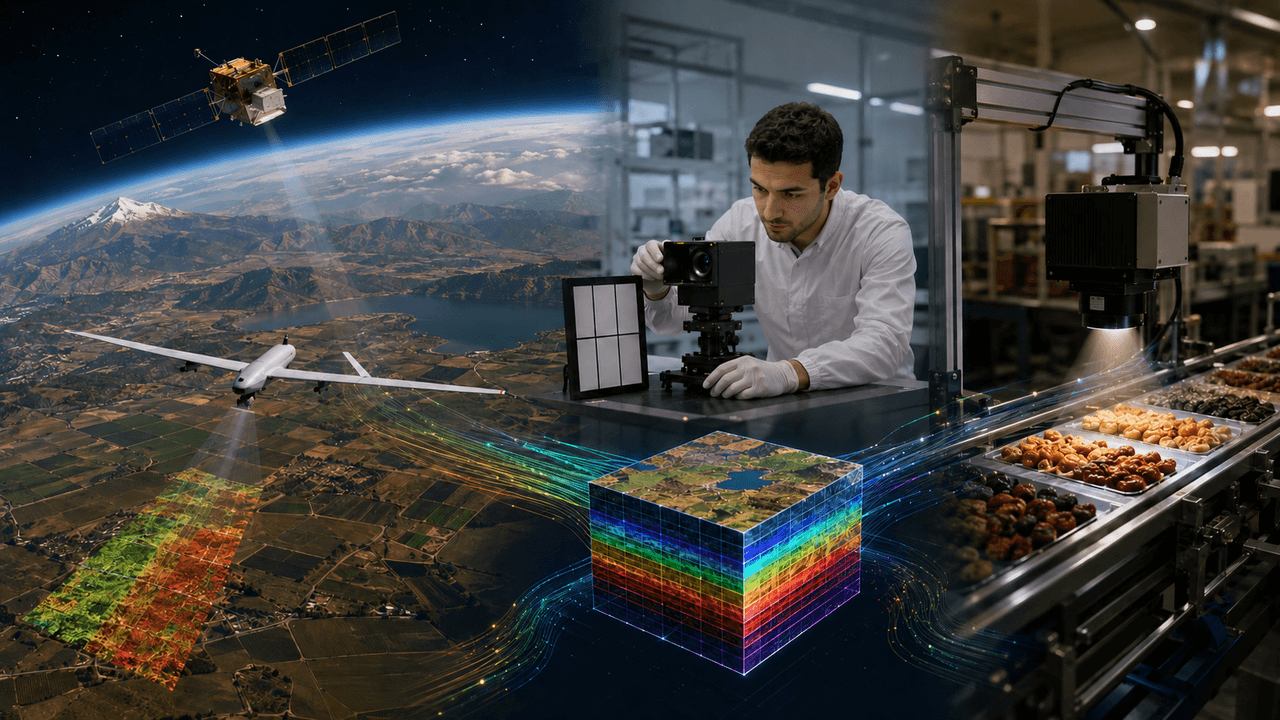
Uydu ve İHA tabanlı gözlemden laboratuvar kalibrasyonuna ve endüstriyel uygulamalara uzanan bütünleşik hiperspektral teknoloji zincirinin temsili. (Yapay Zekâ ile Oluşturulmuştur)
Classification results obtained using artificial intelligence methods can vary depending on the scope of training data and environmental conditions. When evaluating these results, measurement uncertainty, field validation and model interpretability are taken into account.
Research on hyperspectral imaging in Türkiye is conducted in the fields of remote sensing, precision agriculture, defense and electro-optical system development. The TÜBİTAK UZAY HASSAS Project aims to combine multispectral imagery from the national RASAT and GÖKTÜRK-2 satellites with hyperspectral data acquired from airborne platforms to conduct detailed analysis of agricultural products in the Southeastern Anatolia Region.【12】
The Türkiye Space Agency’s description of the İMECE Project identifies “hyperspectral satellite camera infrastructure” as one of the competencies to be developed under the project.【13】
Bioucas-Dias, José M., Antonio Plaza, Nicolas Dobigeon, Mario Parente, Qian Du, Paul Gader, and Jocelyn Chanussot. “Hyperspectral Unmixing Overview: Geometrical, Statistical, and Sparse Regression-Based Approaches.” *IEEE Journal of Selected Topics in Applied Earth Observations and Remote Sensing* 5, no. 2 (2012): 354–379.https://doi.org/10.1109/JSTARS.2012.2194696
Design Bits. "Optik Cam Üçgen Prizma." Photograph. Pexels. Accessed September 15, 2026.
Goetz, Alexander F. H., Gregg Vane, Jerry E. Solomon, and Barrett N. Rock. “Imaging Spectrometry for Earth Remote Sensing.” *Science* 228, no. 4704 (1985): 1147–1153.https://doi.org/10.1126/science.228.4704.1147
Gowen, Aoife A., Colm P. O’Donnell, Patrick J. Cullen, Gerard Downey, and José M. Frias. “Hyperspectral Imaging—An Emerging Process Analytical Tool for Food Quality and Safety Control.” *Trends in Food Science & Technology* 18, no. 12 (2007): 590–598.https://doi.org/10.1016/j.tifs.2007.06.001
Hagen, Nathan, and Michael W. Kudenov. “Review of Snapshot Spectral Imaging Technologies.” *Optical Engineering* 52, no. 9 (2013): 090901.https://doi.org/10.1117/1.OE.52.9.090901
IEEE Standards Association. “IEEE 4001-2025: Standard for Characterization and Calibration of Hyperspectral Imaging Devices.” Accessed September 3, 2026.https://standards.ieee.org/ieee/4001/7314/
Lu, Guolan, and Baowei Fei. “Medical Hyperspectral Imaging: A Review.” *Journal of Biomedical Optics* 19, no. 1 (2014): 010901.https://doi.org/10.1117/1.JBO.19.1.010901
NASA Earthdata. "HyperSpectral Imager for Calibration Science." Accessed September 3, 2026.https://www.earthdata.nasa.gov/data/instruments/hysics
NASA Jet Propulsion Laboratory. “Overview of AVIRIS.” Accessed September 3, 2026.https://aviris.jpl.nasa.gov/html/overview.html
NASA Jet Propulsion Laboratory. “Prime Mission Objectives—EMIT.” Accessed September 3, 2026.https://earth.jpl.nasa.gov/emit/science/objectives/
TÜBİTAK UZAY. "HASSAS Projesinde 2. Gözden Geçirme Aşaması Tamamlandı." Accessed September 3, 2026.https://uzay.tubitak.gov.tr/hassas-projesinde-2-gozden-gecirme-asamasi-tamamlandi/
Türkiye Uzay Agency. "Other Projects: İMECE." Accessed September 3, 2026.https://tua.gov.tr/tr/projeler/diger-projeler
U.S. Geological Survey. “USGS High Resolution Spectral Library.” Accessed September 3, 2026.https://www.usgs.gov/labs/spectroscopy-lab/science/spectral-library
【1】
U.S. Geological Survey, “USGS Spectral Library,” erişim 3 Eylül 2026. https://www.usgs.gov/labs/spectroscopy-lab/usgs-spectral-library.
【2】
IEEE Standards Association, “IEEE 4001-2025: IEEE Standard for Characterization of Hyperspectral Imaging Devices—Ultraviolet Through Shortwave Infrared,” erişim 3 Eylül 2026. https://standards.ieee.org/ieee/4001/7314/
【3】
Alexander F. H. Goetz, Gregg Vane, Jerry E. Solomon ve Barrett N. Rock, “Imaging Spectrometry for Earth Remote Sensing,” Science 228, sy. 4704 (1985): 1147–1153. https://doi.org/10.1126/science.228.4704.1147
【4】
NASA Jet Propulsion Laboratory, “Overview of AVIRIS,” erişim 3 Eylül 2026. https://aviris.jpl.nasa.gov/html/overview.html
【5】
Nathan Hagen ve Michael W. Kudenov, “Review of Snapshot Spectral Imaging Technologies,” Optical Engineering 52, sy. 9 (2013): 090901. https://www.spiedigitallibrary.org/journals/optical-engineering/volume-52/issue-09/090901/Review-of-snapshot-spectral-imaging-technologies/10.1117/1.OE.52.9.090901.full
【6】
U.S. Geological Survey, “USGS Spectral Library.”
【7】
José M. Bioucas-Dias vd., “Hyperspectral Unmixing Overview: Geometrical, Statistical, and Sparse Regression-Based Approaches,” IEEE Journal of Selected Topics in Applied Earth Observations and Remote Sensing 5, sy. 2 (2012): 354–379. https://doi.org/10.1109/JSTARS.2012.2194696
【8】
NASA Jet Propulsion Laboratory, “Prime Mission Objectives—EMIT,” erişim 3 Eylül 2026. https://earth.jpl.nasa.gov/emit/science/objectives/
【9】
Dimitris Manolakis ve Gary Shaw, “Detection Algorithms for Hyperspectral Imaging Applications,” IEEE Signal Processing Magazine 19, sy. 1 (2002): 30, https://www.math.ucdavis.edu/~saito/data/hyperspectral/ieee_sigproc_mag/00974724.pdf?
【10】
Guolan Lu ve Baowei Fei, “Medical Hyperspectral Imaging: A Review,” Journal of Biomedical Optics 19, sy. 1 (2014): 010901. https://doi.org/10.1117/1.JBO.19.1.010901
【11】
Aoife A. Gowen vd., “Hyperspectral Imaging—An Emerging Process Analytical Tool for Food Quality and Safety Control,” Trends in Food Science & Technology 18, sy. 12 (2007): 590–598. https://doi.org/10.1016/j.tifs.2007.06.001
【12】
TÜBİTAK UZAY, “HASSAS Projesinde 2. Gözden Geçirme Aşaması Tamamlandı,” erişim 3 Eylül 2026. https://uzay.tubitak.gov.tr/hassas-projesinde-2-gozden-gecirme-asamasi-tamamlandi/
【13】
Türkiye Uzay Ajansı, “Diğer Projeler: İMECE,” erişim 3 Eylül 2026. https://tua.gov.tr/tr/projeler/diger-projeler

International English Name | Hyperspectral Imaging (HSI) | ||||||||
|---|---|---|---|---|---|---|---|---|---|
Other Name | Imaging Spectroscopy | ||||||||
Relation to National Technology Initiative | Hyperspectral imaging, which requires the development of local sensors, optical systems, satellite and UAV platforms, as well as data processing software, contributes to reducing external dependency in defense, precision agriculture, environmental monitoring, and industrial quality control. In this regard, the technology is directly related to the National Technology Initiative goals of high-value domestic production and technological independence. | ||||||||
Technology Type | Optical imaging and remote sensing technology | ||||||||
Data Structure | Hyperspectral data cube (x, y, λ) | ||||||||
Fundamental Principle | Recording data in numerous adjacent and narrow spectral bands for each pixel | ||||||||
Application Areas | Precision agriculture, environmental monitoring, mining, defense, healthcare, food, and industrial quality control | ||||||||
Main Platforms | Satellite, aircraft, UAV, laboratory, and industrial imaging systems | ||||||||
Related Concepts | Spectral signature, electromagnetic spectrum, remote sensing, image processing | ||||||||
No Discussion Added Yet
Start discussion for "Hyperspectral Imaging" article
Definition and Key Characteristics
Historical Development
Working Principle and System Components
Data Processing and Interpretation
Applications
Remote Sensing, Agriculture and Environment
Defense and Security
Health, Food and Industry
Technical Characteristics and Limitations
Research in Türkiye