


This article was automatically translated from the original Turkish version.
+1 More
The fishbone diagram, also known as the Ishikawa diagram or cause-and-effect diagram, is an analytical tool frequently used in quality management and problem-solving processes. This diagram visually organizes the potential causes of a specific problem in a systematic manner.
The use of systematic analysis tools in quality management is critical for process improvement and the identification of root causes. The cause-and-effect diagram developed by Kaoru Ishikawa facilitates the visual analysis of problems and contributes to problem-solving processes. It is called a “fishbone” diagram because its structure resembles the skeleton of a fish.
The fishbone diagram consists of a main spine (body) with branches representing categorized causes. At the end of the spine is the primary problem or effect being analyzed. The causes leading to this effect are grouped into major categories, and sub-causes are added under each category to expand the analysis.
The commonly used main categories are:
These categories can be modified according to the problem and expanded as needed.
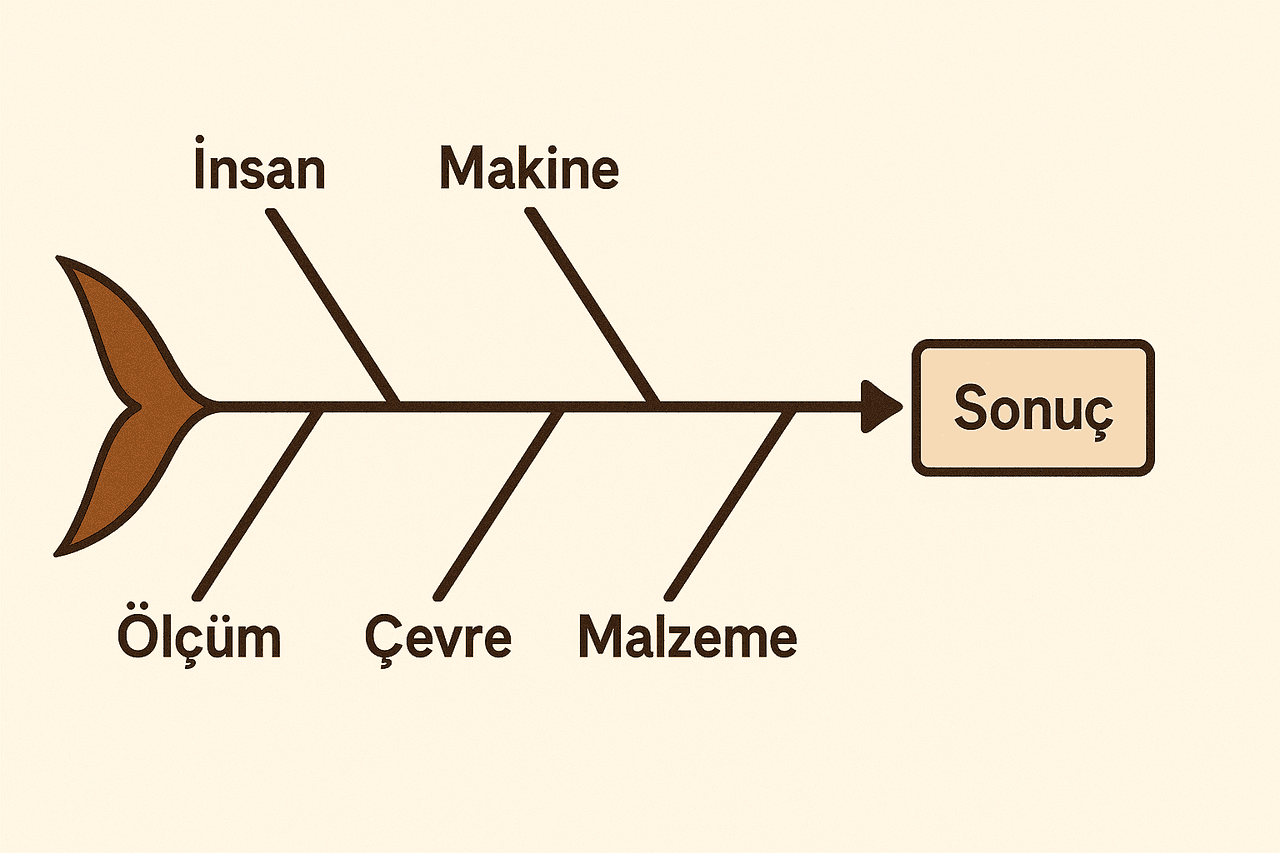
Fishbone Diagram (generated by Artificial Intelligence)
The fishbone diagram is used across numerous industries and fields:
In each field, the goal is to classify and visualize the root and sub-causes affecting the problem in order to develop effective solutions.
The fishbone diagram is regarded as an integral part of quality improvement processes. By enabling the visual representation of cause-and-effect relationships, it makes problems more understandable and allows systematic development of solutions. In this way, it directly supports organizational decision-making. However, the effectiveness of this tool depends on the accurate collection of data and the proper definition of cause categories.
Coccia, Mario. “The Fishbone Diagram to Identify, Systematize and Analyze the Sources of General Purpose Technologies.” Journal of Social and Administrative Sciences 4, no. 4 (2018): 291–303. Date Published: January 11, 2018. Accessed June 20, 2025. https://papers.ssrn.com/sol3/papers.cfm?abstract_id=3100011.
Juran, Joseph M., and A. Blanton Godfrey. Juran's Quality Handbook. 5th ed. New York: McGraw-Hill, 1999.
Montgomery, Douglas C. Introduction to Statistical Quality Control. 7th ed. Hoboken, NJ: John Wiley & Sons, 2012.

No Discussion Added Yet
Start discussion for "Fish Gill Arch Diagram" article
Structure and Components of the Fishbone Diagram
Application Areas
Advantages and Limitations
Advantages
Limitations