This article was automatically translated from the original Turkish version.
+2 More
Richter Scale is a logarithmic scale used to determine the magnitude of an earthquake, that is, the quantitative measure of seismic energy released at the Earth’s surface. This scale was developed in 1935 by American seismologist Charles Francis Richter. Richter’s goal was to create an objective and comparable system for classifying earthquakes occurring in Southern California. In this context, the scale was based on measurements taken with a Wood-Anderson type short-period seismograph, using the amplitude of ground motion recorded at a distance of 100 kilometers from the earthquake’s epicenter.
The criterion used in developing the scale is the maximum amplitude recorded on a seismogram. Richter calculated the logarithm of this amplitude to determine the magnitude, designing the scale so that each unit increase corresponds to a tenfold increase in seismic wave amplitude. For example, an earthquake of magnitude 5 produces about ten times more ground motion than an earthquake of magnitude 4, but the energy released is approximately 31.5 times greater. Therefore, the scale effectively captures both the intensity of ground shaking and the energy released.

Designed with the assistance of artificial intelligence.
Initially developed for earthquakes specific to Southern California, the Richter Scale was quickly adopted worldwide. However, over time it became evident that the scale was inadequate for measuring earthquakes of different types, depths, and distances. As a result, alternative magnitude scales such as the Moment Magnitude Scale (Mw) were developed. Nevertheless, the term “Richter scale” continues to be widely used in public discourse to refer generally to the magnitude of earthquakes.
The Richter Scale has a logarithmic structure, meaning it expresses the seismic energy released by an earthquake not as a multiplicative factor but as an exponential value. The magnitude is calculated by taking the logarithm of the maximum amplitude recorded on a seismogram, normalized to a standard distance of 100 kilometers and measured using a specific type of seismograph. The magnitude (M) is generally expressed by the following formula:
M = log₁₀(A) + B(Δ)
In this equation, A is the maximum ground motion amplitude recorded by the seismograph, measured in millimeters; B(Δ) is a correction factor that depends on the distance (Δ) from the epicenter. Richter’s original definition was based on measurements taken with the Wood-Anderson seismograph. Consequently, early applications of the scale were valid only for this instrument and under specific distance conditions.
The logarithmic nature of the scale implies that each unit increase in magnitude results in substantial differences in both ground motion and energy release. In terms of amplitude, each unit increase corresponds to a tenfold increase in ground shaking, while in terms of energy, it corresponds to an increase of approximately 31.6 times. For example, an earthquake of magnitude 6 produces about ten times greater ground motion and approximately 31.6 times more energy than an earthquake of magnitude 5. Similarly, an earthquake of magnitude 7 releases roughly 1000 times more energy than one of magnitude 5 (31.6 × 31.6 ≈ 1000).
This mathematical foundation transformed the Richter Scale into a quantitative and comparable unit of measurement, not merely qualitative. However, the scale’s limitations—its restricted amplitude range and dependence on specific instruments—laid the groundwork for the development of more comprehensive systems such as the Moment Magnitude Scale.
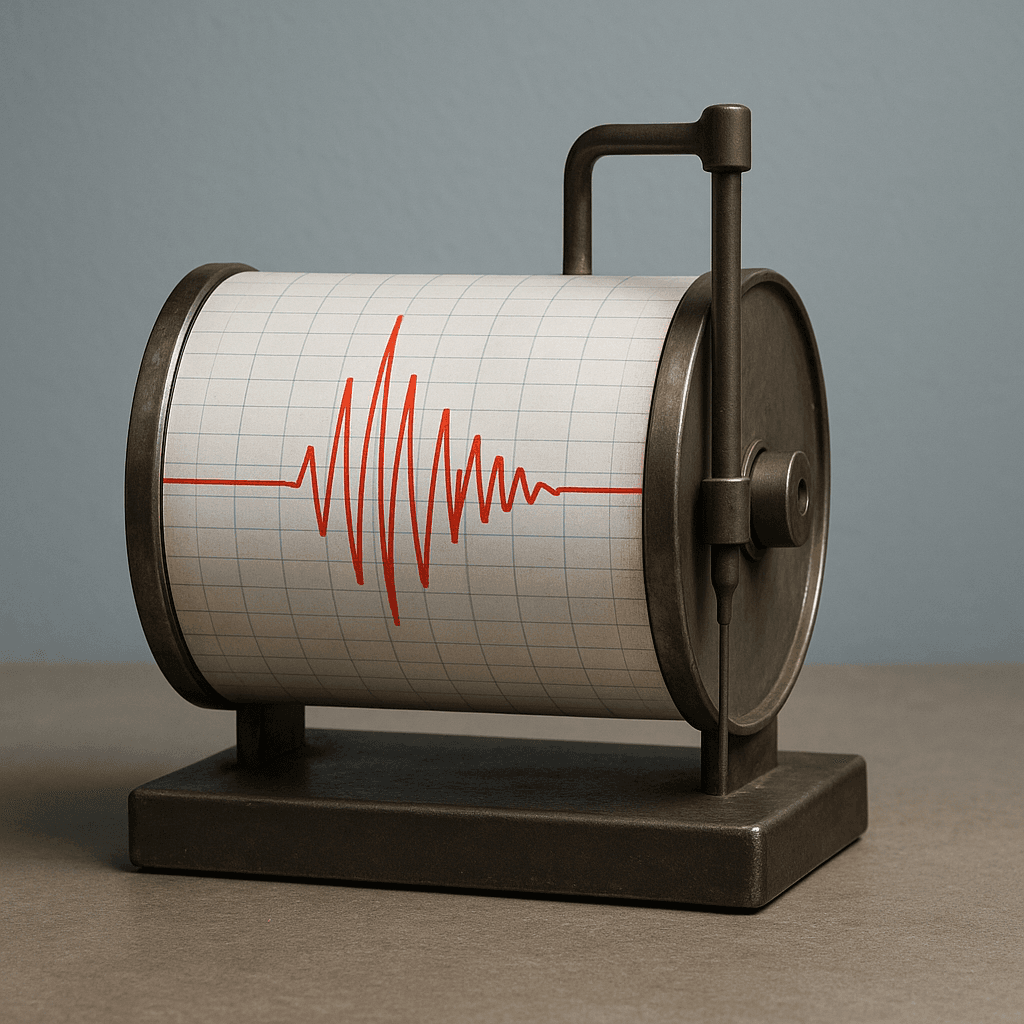
The Richter Scale operates directly on data produced by instruments known as seismographs, which detect and record ground motion with high precision. At its core, a seismograph consists of a mass suspended freely from a frame fixed to the ground. During an earthquake, when the ground moves, the inertia of the suspended mass causes it to remain relatively stationary, and the relative motion between the mass and the ground is recorded as a trace on a moving paper by a pen. This record is called a seismogram.
The lines on a seismogram vary according to the intensity and type of the earthquake. The amplitude, or height of the lines, reflects the magnitude of ground motion; the frequency indicates the duration and nature of the movement. These data allow scientists to determine the earthquake’s epicenter, magnitude, and depth.
The most important data recorded by a seismograph during an earthquake are P-waves (primary waves), S-waves (secondary waves), and surface waves. P-waves are longitudinal waves that originate at the focus and cause particles in the medium to vibrate in the direction of wave propagation; they are the fastest-moving waves and the first to reach the seismograph. They can travel through solids, liquids, and gases.
S-waves are transverse waves that can propagate only through solid media and cause particles to vibrate perpendicular to the direction of wave travel. They move more slowly than P-waves and are recorded second. The last to arrive and typically the most destructive are surface waves; these waves travel along the Earth’s surface and have particularly damaging effects on structures.
To determine the location of the epicenter—the point on the Earth’s surface directly above the earthquake’s focus—data from at least three different seismograph stations are used, specifically the time difference between the arrival of P-waves and S-waves. From this time difference, the distance from each station to the epicenter is calculated and plotted as circles on a map. The point where these circles intersect identifies the epicenter.
Thanks to modern seismograph networks and data analysis software, earthquakes occurring anywhere in the world can now be recorded and their magnitudes calculated automatically within seconds. These advancements have facilitated the more efficient and widespread use of the Richter Scale and have also contributed to the development of new magnitude measurement systems.
Two fundamental concepts frequently confused in earthquake assessment are “magnitude” and “intensity.” The Richter Scale measures the magnitude of an earthquake—that is, the total seismic energy released at the source—while intensity evaluates local effects. Therefore, while the magnitude of an earthquake remains constant, the perceived intensity can vary across different regions.
Earthquake magnitude is expressed as a single numerical value and represents the energy released at the earthquake’s source. Magnitude is determined based on the amplitudes of ground motion recorded by seismographs and corrected for distance from the epicenter. This measurement is objective, reproducible, and suitable for global comparisons. In addition to the Richter Scale, the Moment Magnitude Scale (Mw) is another modern system used for this purpose.

Created with the assistance of artificial intelligence.
In contrast, earthquake intensity describes the effects of an earthquake on people, structures, and the natural environment. Intensity can vary at different locations and is generally based on observational data. One of the most widely used intensity scales is the Modified Mercalli Intensity Scale (MMI). This scale consists of 12 levels, ranging from I to XII, each describing the observed effects during an earthquake.
For example, an MMI value of VII describes an earthquake capable of causing light damage to well-built structures and serious damage to poorly constructed ones. However, this value can vary depending on distance from the epicenter, ground composition, and architectural characteristics of settlements. The same earthquake of magnitude 6.5 might be felt at intensity V in a city built on bedrock but reach intensity VII in a city constructed on soft alluvial soil.

Created with the assistance of artificial intelligence.
Therefore, a direct equivalence cannot be established between magnitude and intensity. Magnitude is a fixed measurement, while intensity depends entirely on local conditions and observations. This conceptual distinction is of great importance for disaster management, engineering design, and public awareness.
Although the Richter Scale was the primary tool for measuring earthquake magnitude until the mid-20th century, it has gradually been replaced by more advanced systems due to various limitations. These include its validity only for specific distances and instrument types, its saturation effect with large earthquakes, and its inadequacy for comparing earthquakes globally. In this context, two main alternative systems have emerged: the Moment Magnitude Scale (Mw) and the Modified Mercalli Intensity Scale (MMI).
Moment Magnitude Scale (Mw) is calculated based on the area of the fault rupture, the amount of displacement, and the elastic properties of the rock. Developed in the 1970s, this scale is now preferred by scientific and international institutions because it more accurately reflects the energy released by large earthquakes. The Moment Magnitude Scale provides a single standard for all earthquake magnitudes, whereas the Richter Scale retains its applicability primarily for shallow earthquakes with magnitudes below 6. The Mw scale also follows a logarithmic structure, with each unit increase corresponding to approximately 31.6 times more energy release.
Modified Mercalli Intensity Scale (MMI) is used to describe the local effects of an earthquake. This scale, numbered from I to XII, evaluates earthquakes based on direct observations of human perception and structural damage. It covers a broad spectrum from imperceptible shaking (I) to total destruction (XII). Unlike Mw or Richter, MMI values are not fixed; they can vary across regions for the same earthquake depending on distance from the epicenter, ground structure, and building quality. In this sense, MMI is an observational classification rather than a physical energy measurement.
Today, particularly through the ShakeMap system developed by the United States Geological Survey (USGS), MMI and Mw data are integrated to present both the energy level and surface effects of earthquakes simultaneously. Additionally, empirical relationships have been established between these systems and instrumental measurements such as PGA (Peak Ground Acceleration) and PGV (Peak Ground Velocity). As a result, intensity maps can now be generated based on a single magnitude value.
In conclusion, while the Richter Scale retains historical significance, it is no longer sufficient on its own to understand and compare earthquakes. The Moment Magnitude Scale provides a more comprehensive energy-based analysis, while intensity scales like MMI serve as powerful tools for defining the local impact of seismic events.
The İzmit Earthquake of August 17, 1999, stands as one of the most impactful seismic events in Türkiye’s recent history, both in terms of magnitude and destructiveness. With a magnitude of approximately 7.4, this earthquake caused significant damage not only in Kocaeli and Sakarya but also in Istanbul. In the aftermath, efforts were initiated to improve disaster management by evaluating intensity not only through instrumental data but also through direct public observations. In this context, the Community Internet Intensity (CII) method emerged as one of Türkiye’s pioneering new approaches.
CII is a system that rapidly and cost-effectively generates intensity maps based on public observations shared via the internet. The applicability of this method to the 1999 İzmit Earthquake was tested in a master’s thesis prepared at the Institute of Science of Istanbul Technical University. Observations from 150 neighborhoods were analyzed according to responses to predefined index questions, and a CII map was produced.
The indices used in this analysis were categorized under headings such as perception, movement, reaction, posture, shelves, pictures, furniture, and damage, each converted into numerical values. For instance, the response to the question “Did you feel the earthquake?” determined the perception index, while questions like “Did items in your home move?” shaped the furniture index. The total scores from these indices were converted into CII values using a logarithmic transformation.
The calculated CII values were also compared with PGA (Peak Ground Acceleration) data. Measurements in Istanbul districts such as Adalar, Avcılar, Bakırköy, Beşiktaş, Fatih, and Küçükçekmece showed that CII-based intensity maps were largely consistent with instrumental measurements. In particular, areas like Avcılar and Küçükçekmece, which have weak ground conditions, exhibited high intensity values despite being distant from the epicenter, demonstrating CII’s capacity to accurately reflect ground effects.
This application demonstrates that the CII method can serve as a functional and effective tool for rapid post-disaster response planning under Türkiye’s conditions. Moreover, through its participatory data collection approach, it plays a role in enhancing public earthquake awareness.
The limitations of traditional methods for assessing earthquake intensity have increased the need for alternative models in recent years. Particularly with the advancement of information and communication technologies, systems that integrate direct public observations with instrumental measurements have gained prominence. Among the most notable approaches are the Community Internet Intensity (CII), Peak Ground Acceleration (PGA), and Peak Ground Velocity (PGV), along with survey-based models that integrate them.
CII is a method for assessing intensity based on community observations. This system aims to rapidly evaluate earthquake intensity using responses to online surveys. Its main advantage is the ability to collect large volumes of data from wide areas without requiring field observations or expert intervention. Survey questions include physical and psychological observations such as the intensity of shaking felt, whether household items moved, and whether structural damage occurred. Each response is converted into an intensity index, culminating in a total score called the Community Weighted Sum (CWS), which is then transformed logarithmically into a CII score.
These observational methods are also compared with instrumental intensity measurements. PGA, or peak ground acceleration, reflects the sudden force of ground motion, while PGV, or peak ground velocity, indicates the maximum ground speed and is important for understanding lasting deformations. Empirical relationships developed by Wald and colleagues allow intensity to be estimated from PGA and PGV values. For example, a direct conversion can be made between log(PGA) values and the Modified Mercalli Intensity (MMI) scale. This enables intensity assessment in a region using both instrumental data and public observations.
The greatest advantage of these models is the ability to obtain critical information for post-disaster response within hours. When CII maps are compared with PGA or PGV maps, the intensity distributions show considerable agreement. In the case of the 1999 İzmit Earthquake, for instance, high intensity values in areas with weak ground conditions were confirmed by surveys, demonstrating that CII accurately reflects real-world conditions on the ground.
Another notable aspect in the development of next-generation survey-based systems is mobile compatibility and geolocation-based data collection. The ability of users to submit earthquake observations via smartphones, along with location and time data, provides near real-time information flows for disaster management.
In conclusion, the combined use of CII, PGA, PGV, and similar models holds significant potential not only for academic analysis but also for enabling rapid decision-making by local authorities and disaster management units.
Each method used to determine earthquake magnitude and intensity offers specific advantages but also has limitations. This section provides a comprehensive evaluation of the strengths and weaknesses of the Richter Scale, the Moment Magnitude Scale (Mw), the Modified Mercalli Intensity Scale (MMI), and the CII (Community Internet Intensity) method.
Considering these strengths and weaknesses, an ideal earthquake intensity assessment system should be built on hybrid models that integrate both instrumental and observational data. This allows simultaneous evaluation of both the physical dimension and the social impact of seismic events.
Accurate and timely determination of earthquake magnitude and intensity plays a critical role not only in scientific analysis but also in the effectiveness of disaster management and emergency response. Data obtained from methods such as Richter, Moment Magnitude, MMI, and CII ensure that both decision-makers and the public have access to accurate information. These data have multidimensional applications and can be integrated into all phases of disaster management.
In early response planning, instrumental intensity data (PGA, PGV) combined with real-time observational intensity data from systems like CII enable prioritization of affected areas. For example, settlements reporting high intensity values after an earthquake become priority targets for search and rescue teams. This information is also decisive for deploying health, logistics, and security units.
In disaster mapping and risk analysis, modeling the magnitude and intensity distributions of past earthquakes allows determination of hazard levels in specific regions. Particularly, neighborhood-level intensity data obtained through the CII method can be linked with factors such as building stock, ground properties, and population density to produce detailed risk maps. These maps serve as important references in urban renewal, building inspection, and land-use planning processes.
In public awareness and education, community-based systems like CII do more than collect data; they also enhance public earthquake awareness. The widespread use of surveys develops the public’s ability to observe and report seismic activity, transforming passive observers into active information providers.
In education and training scenarios, magnitude and intensity maps derived from real earthquake data can be used for simulations. These data, showing how a region was affected over time and space, enable more realistic scenario development.
In international cooperation and data sharing, Moment Magnitude data and intensity maps integrated with observational systems like CII enrich global disaster databases. Such datasets can serve as guides for establishing early warning and preparedness systems, particularly in developing countries.
Information obtained about earthquake magnitude and intensity serves not only to understand the event itself but also to develop strategies for limiting its impacts. Integrating methods that combine scientific accuracy with public participation is a fundamental requirement for building more resilient and aware societies.
"Depremler, Deprem Dalgaları ve Sismograf Üzerine Bilgilendirme." *Mühendislik Jeolojisi Notları.* Accessed April 23, 2025. https://avys.omu.edu.tr/storage/app/public/zekikrc/70039/m%C3%BCh.%20jeolojisi%205.pdf.
Boğaziçi ÜniversitesiKandilli Rasathanesi and Earthquake Research Institute. "Magnitüd / Şiddet Karşılaştırması." Accessed April 23, 2025. http://www.koeri.boun.edu.tr/sismo/bilgi/xMercalli.htm.
Ocak, Mahir E. “Richter Ölçeği Nedir?” Bilim Genç, August 17, 2016. Accessed April 23, 2025. https://bilimgenc.tubitak.gov.tr/makale/richter-olcegi-nedir.
SMS Tsunami Warning. "Richter Scale." SMS Tsunami Warning. Accessed April 23, 2025. https://www.sms-tsunami-warning.com/pages/richter-scale.
Sevilgen, Volkan. *Deprem Şiddet Dağılımının İnternet İletişim Sistemi ile Saptanması*. Master's thesis, Istanbul Technical University Institute of Science and Technology, 2006. Accessed April 23, 2025. https://polen.itu.edu.tr:8443/server/api/core/bitstreams/660e13f0-6ecc-4491-b080-69cb0a09b834/content.
Torun, Can. “Depremin Şiddeti Nasıl Ölçülür?” *Bilim Genç*, February 19, 2023. Accessed April 23, 2025. https://bilimgenc.tubitak.gov.tr/makale/depremin-siddeti-nasil-olculur.
U.S. Geological Survey. “Moment Magnitude, Richter Scale—What Are the Different Magnitude Scales, and Why Are There So Many?” U.S. Geological Survey. Accessed April 23, 2025. https://www.usgs.gov/faqs/moment-magnitude-richter-scale-what-are-different-magnitude-scales-and-why-are-there-so-many.
U.S. Geological Survey. “The Modified Mercalli Intensity Scale.” U.S. Geological Survey. Accessed April 23, 2025. https://www.usgs.gov/programs/earthquake-hazards/modified-mercalli-intensity-scale.
Mathematical Basis of the Scale
Seismographs and Seismic Wave Records
Earthquake Magnitude and Intensity: Conceptual Distinction
Comparison with Alternative Scales
Example from Türkiye: The 1999 İzmit Earthquake and CII Application
New Approaches: CII, PGA, PGV, and Survey-Based Models
Strengths and Weaknesses of the Methods
Strengths
Weaknesses
Applications in Disaster Management