


This article was automatically translated from the original Turkish version.
+1 More
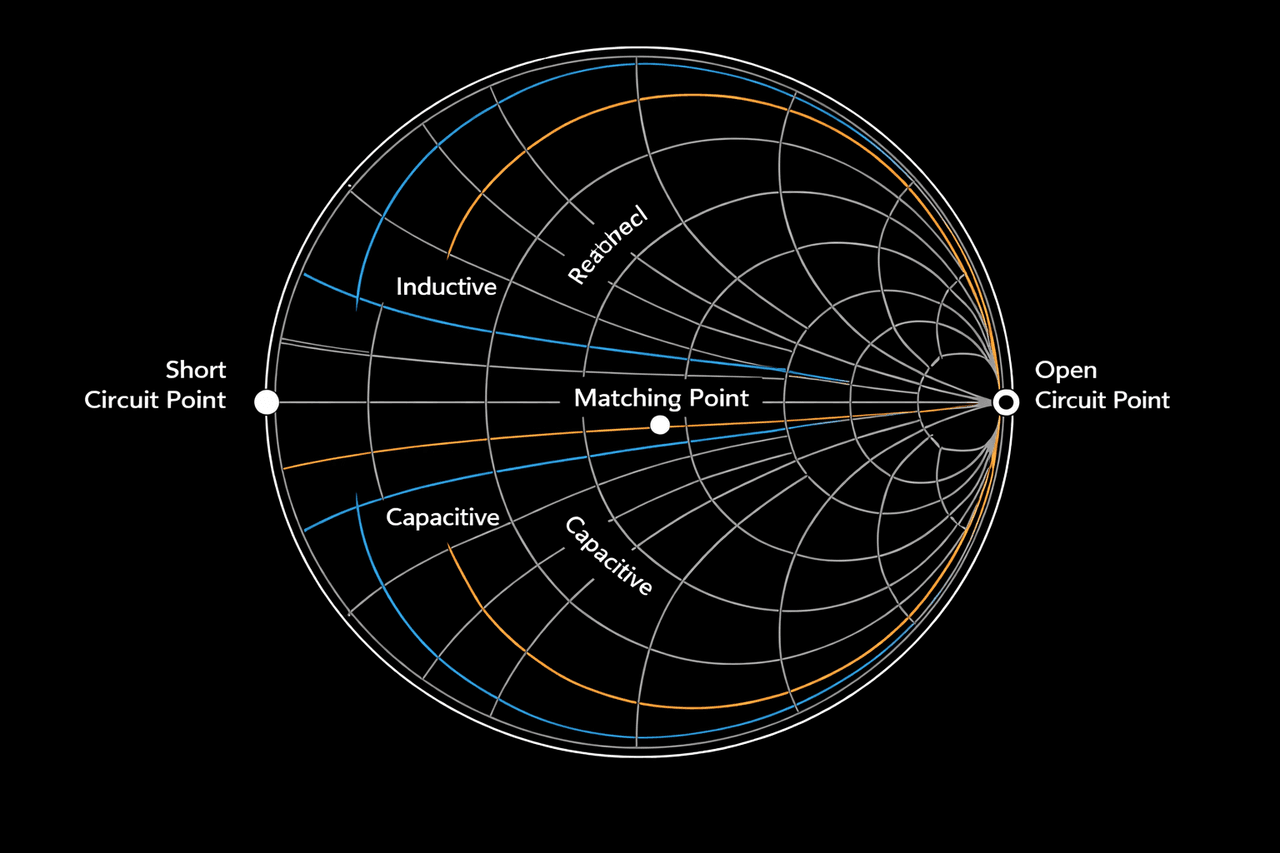
Smith Diyagramı (Yapay zeka ile oluşturulmuştur)
The Smith chart (or Smith abacus) is a tool that enables the graphical solution of complex mathematical problems in radio frequency (RF) engineering, such as transmission line impedance matching, reflection coefficient analysis, and stability calculations. Developed in 1939 by Bell Telephone Laboratories engineer Phillip H. Smith, this chart visualizes complex impedance and admittance values on the complex plane by projecting them onto the reflection coefficient plane. Today it remains the standard data display format in modern circuit simulation software and vector network analyzers (VNA).

Basic representation of the Smith Chart (generated by artificial intelligence)
Phillip H. Smith developed this graphical method to avoid the repetitive and laborious mathematical calculations required to determine standing wave ratios and impedance variations on transmission lines in the 1930s. Although Japanese engineer T. Mizuhashi independently developed a similar graphical tool at the same time, Smith’s design became the global standard.
The Smith chart is based on the mathematical relationship between complex impedance (Z) and complex reflection coefficient (). On a transmission line, the relationship between the load impedance (ZL) and the characteristic impedance (Z0) determines the reflection coefficient.
To make the chart universally applicable, impedance values are normalized by dividing them by the system’s characteristic impedance ().
Here, is the normalized resistance (real part), and is the normalized reactance (imaginary part).
The Smith chart is a conformal (angle-preserving) transformation of the normalized impedance plane (z) onto the reflection coefficient plane (). This relationship is expressed by the following formula:
Conversely, when the reflection coefficient is known, the impedance at that point is calculated as:
This transformation maps the infinite impedance plane in Cartesian coordinates (right half-plane) into the interior of a unit circle ().

Transformation of the normalized impedance plane into the reflection coefficient plane. (generated by artificial intelligence)
The Smith chart consists of the superposition of two families of curves:
On the Smith chart, three critical points define key circuit behaviors:
The chart is a fundamental tool for designing impedance matching circuits, implementing stub matching, and calculating VSWR (Voltage Standing Wave Ratio).
All About Circuits. "Smith Diyagramının Matematiksel Yapısı ve Özellikleri." Accessed December 10, 2025. https://www.allaboutcircuits.com/technical-articles/mathematical-construction-and-properties-of-the-smith-chart/
Amanogawa. "Notes on Smith Chart." Digital Maestro Series (2006). Accessed December 10, 2025. https://www.ee.hacettepe.edu.tr/~sevda/index_files/NotesOnSmithChart.pdf
ElProCus. "Smith Diyagramı Nedir? Nasıl Kullanılır?" Accessed December 10, 2025. https://www.elprocus.com/what-is-a-smith-chart-basics-types-its-applications/
Rohde & Schwarz. "Understanding the Smith Chart." Accessed December 10, 2025. https://www.rohde-schwarz.com/se/products/test-and-measurement/essentials-test-equipment/spectrum-analyzers/understanding-the-smith-chart_257989.html
Transfer Multisort Elektronik. "Smith Diyagramı Nedir ve Nasıl Okunur?" Accessed December 10, 2025. https://www.tme.eu/en/news/library-articles/page/70732/what-is-and-how-to-read-the-the-smith-chart/

Smith Diyagramı (Yapay zeka ile oluşturulmuştur)
History
Mathematical Foundation and Formulas
Normalized Impedance
Reflection Coefficient Transformation
Structure and Components
Applications and Critical Points